Which batting stat correlates best with WAR?
- Ayush Arora

- Feb 5, 2019
- 4 min read
Last weekend, I studied the correlation between numerous pitching stats and WAR: https://ayarora.wixsite.com/baseball/home/which-pitching-stat-correlates-best-with-war
This weekend, I imported batting stats accumulated from the 2018 season for all 30 MLB teams to figure out:
In 2018, which FanGraph batting statistic correlated with WAR (wins above replacement) the best?
I downloaded batting stats (standard, advanced, batted ball, pitch type, etc.) accumulated from the 2018 season for all 30 MLB teams from fangraphs.com, converted the CSV file to an excel friendly file using Microsoft Excel, then imported this file into Tableau.
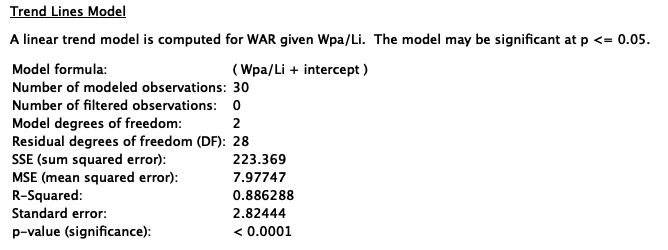
I created a scatterplot for each of the 304 different batting stats against WAR, ran trend line analysis to gather the R^2 correlation coefficient for each graph. (all scatterplots are at the bottom of article)
Statistics Lesson: In this case, the R^2 correlation coefficient shows the percentage variation in WAR which is explained by a specific pitching statistic.
After reading the "describe trend model" page that Tableau created for each scatterplot, Wpa/Li came out with the highest correlation coefficient value of 0.89.
Let's break it down and define Wpa first.
Wpa, Win Probability Added, captures the difference that each player's plate appearance makes in the win expectancy for their team. It distinguishes and rewards a walk-off homerun in the bottom of the 9th rather than a meaningless homerun in the 6th inning of a blowout game.
For example, let's say the Giants have a 35% chance of winning (shocker...) before Buster Posey's at bat with the bases loaded. Buster Posey hits a grand slam, skyrocketing the Giants' win expectancy to 70%. That difference in win expectancy is Buster Posey's current Wpa (0.70 - 0.35 = 0.35). In a later at bat, let's say Buster Posey strikes out and lowers the Giants' win expectancy by 2%. His overall Wpa for the game would be 0.35 - 0.02 = 0.33.
This stat explains not how well a specific player performed, but how important their performance was.
In my opinion, this stat alone could be biased to players who happen to find themselves in these "clutch" situations more often than others, thus inflating their Wpa value.
LI, leverage index, measures how critical a specific situation is in the context of the whole game. It is calculated by measuring the swing of potential change in win expectancy by the result of the plate appearance.
Going back to the Buster Posey example, where the Giants win expectancy was 35% before his at bat, let's say that the only possible results of the at bat are a strikeout or a grand slam (to make it simple). Assume each result occurs 50% of the time on average. After a grand slam, the win expectancy would be 0.75 & after a strikeout, it would be 0.25. Also, assume that the average swing in win expectancy for any plate appearance is 0.04.
The equation to calculate LI for this situation would be:
( (0.5 * 0.35) + (0.5 * 0.10) ) / 0.04 = 5.625 Li !!!
0.5 - average % chance of an event (strike out or grand slam) happening
0.35 - difference in win expectancy because of grand slam
0.10 - difference in win expectancy because of strikeout
0.04 - average swing in win expectancy for any plate appearance
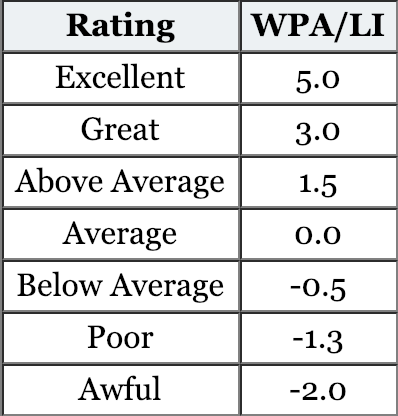
An LI of 1 is average, anything below 0.85 is low leverage & anything above 2 is high leverage.
Now that we have defined both Wpa and Li, we can understand Wpa/Li.
As I mentioned before, Wpa might be biased because some players will have more opportunities in higher leverage situations.
However, if we divide Wpa by Li, we can see how much a player contributes to the team's win expectancy regardless of the leverage. This rate neutralizes leverage while still calculating wins added.
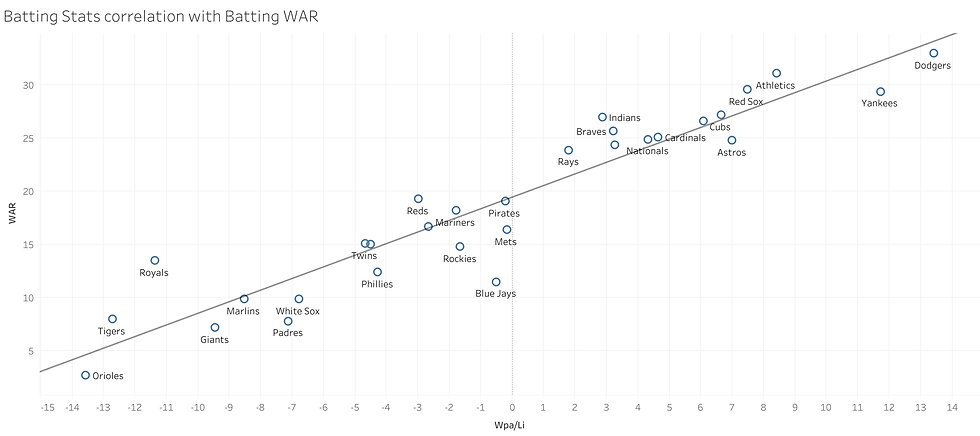
Scatterplot of Wpa/Li vs WAR:
Graph Analysis
The vertical line running through the middle of the graph is the average Wpa/Li, denoting that teams to the left of this line had a below average Wpa/Li in 2018 and teams to the right had an above average Wpa/Li.
13 teams had an above average Wpa/Li with the Dodgers having the highest of the pack at 13.42.
17 teams had a below average Wpa/Li with the Orioles having the worst of them all at -13.57.
The diagonal line running through the graph is the line of best fit (a line that best represents the data on the scatterplot)
The equation of this line is WAR = 1.092*Wpa/Li + 19.443.
The Colorado Rockies are the only team that had a below average Wpa/Li but still managed to slip into the 2018 MLB playoffs. Their offense had a down year, but pitchers German Marquez & Kyle Freeland were able to weather the Coors field effect to keep the team in contention. I'm curious to see how the offense and pitching pans out for the Rockies in 2019.
The Toronto Blue Jays are the farthest from the line of best fit in the negative direction. With a Wpa/Li of -0.5, their expected WAR was 19, while their actual WAR turned out to be 11.5, a difference of 8.5 WAR.
With the addition of Vladimir Guerrero Jr, arguably the most polished prospect in the history of the sport, the Blue Jays could be an offensive threat that could turn some heads in an ultra competitive AL East.
Out of the more relevant teams (sorry Royals & Tigers), the Cleveland Indians are the farthest team from the line of best fit in the positive direction. With a Wpa/Li of 2.87, their expected WAR was 22.5, while their actual WAR came out to be 27, a difference of 5 wins.
Although the Indians were the only team to finish above .500 in the Al Central, the Minnesota Twins are an up and coming team who has a shot at catching up this year. With the homegrown players entering their prime, highlighted by Jose Berrios and Byron Buxton, and a few free agent additions, notably Nelson Cruz and Jonathan Schoop, there could be a new team with the AL Central crown in 2019.
The conclusion drawn from this analysis is that situational hitting is highly associated with batting WAR.


Comments